Seattle’s Carbon Footprint: Assessing The Assessment
The City of Seattle just released its 2008 greenhouse gas inventory, and in most of the media reports, the results get distilled down to this headline:Â Seattle’s emissions are seven percent below 1990 levels. Or perhaps even further distilled to:Â Seattle is meeting the Kyoto protocol. Sure sounds good, but the reality is much more mixed and messy.
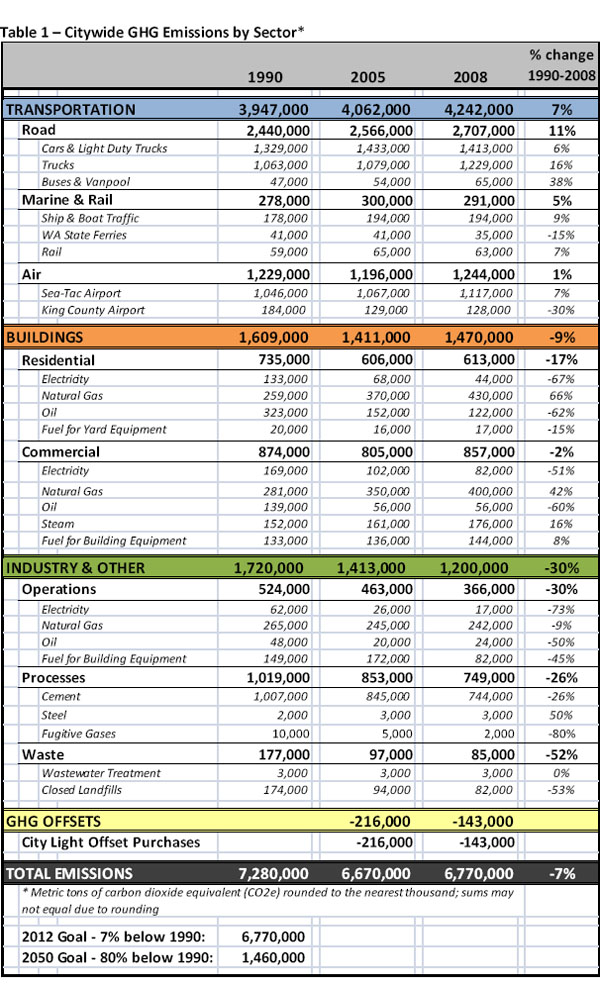
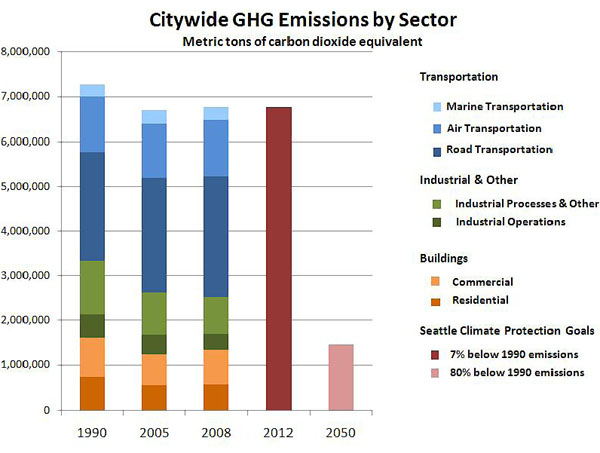
The big trend that the bar chart above shows is that greenhouse gas (GHG) emissions dropped significantly from 1990 to 2005, then inched back up slightly in 2008.  (See the table below the jump for the numbers.) What has happened since 1990 that caused the net reduction in emissions even as population grew by 16 percent? In short, the main reasons are:
- automobile fleet efficiency rose by nine percent, which offset much of the increase in vehicle miles traveled
- total energy use in residential buildings decreased, even as the number of households grew
- energy use in the industrial sector decreased (though the report does not say how much of this may be due to a decline in industrial activity)
- the GHG emissions factor for Seattle’s electricity is less than half of what it was in 1990
There’s a lot buried in those four bullets, too much for one post. The second point is the most unambiguous success story for Seattle.
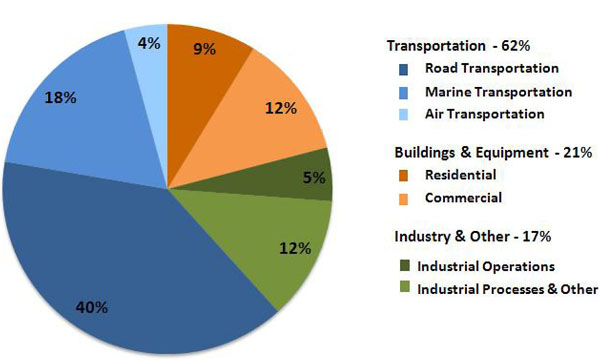
But the last point highlights a key Seattle idiosyncrasy that is critical to honestly assessing our carbon footprint: 89 percent of our electricity is carbon-free hydropower. And since transportation uses very little electricity, for Seattle the blue pieces of pie become much bigger in the chart below. For the U.S. as a whole, transportation accounts for only about a third of GHG emissions.
Although Seattle City Light (SCL) is technically carbon-neutral, the Seattle inventory attributes a small amount of GHG emissions to electricity use—for 2008, the report assumes an emissions factor for Seattle that is a mere three percent of the U.S. average. SCL has reduced their emissions factor over the past decade or so by shifting their fuel mix from fossil fuels to renewable sources such as wind, and by purchasing carbon offsets. Thus, even if electrical energy use had remained constant since 1990, the inventory would have shown a decrease in emissions.
It’s great that Seattle has access to low-carbon electricity, but unfortunately that fact can also lead to misperceptions about our current status and where we should be focusing future efforts. For one thing, it’s not exactly fair for Seattle to tout its low carbon footprint compared to other cities when the main reason for it is that we happen be located near some big hydropower dams that were built before anyone even knew what a global greenhouse gas was.
Just because electricity consumption in Seattle produces relatively little GHGs, we should be trying to reduce electricity use just as much as any other city for two reasons: (1) the electricity grid is regional, and every clean kWh that’s not used here in Seattle is a clean kWh that becomes available somewhere else, and (2) our hydropower is maxed out, and global warming is expected to decrease capacity as mountain snowpack is reduced. Furthermore, if we hope to start using electric cars on any significant scale, all that electricity has to come from somewhere.
The regional nature of electricity underscores the complexities involved with any attempt at a truly comprehensive GHG inventory for a specific area: the factors that drive GHG emissions cross boundaries—a city gives and takes from a much larger surrounding system—effectively the entire planet, in fact. And this presents a major challenge to the viability of city-specific goals, such as the recently proposed goal to make Seattle carbon-neutral by 2030. We don’t yet know how that would even be defined, much less measured accurately.
But the Seattle inventory is a great start at “measuring what matters.” It captures most of the major sources, and we can build on it. Below are some random ideas on what it’s missing, the unknowns, possible improvements, etc:
- How we account for road travel across city limits? Currently only VMTs within the city are counted.   Consider the example of a bedroom suburb where most commuters work elsewhere. Such a community should bear some of the responsibility for the emissions produced by residents who have to travel outside community boundaries to meet the daily needs of their lives.
- Food systems are a major source of GHGs—meat production alone produces and estimated 18 percent of global emissions. Much of the emissions associated with food systems is captured in the standard sectors, but the bulk of food production and transport occurs outside a typical city’s boundaries. How would city full of a “locavore” vegetarians get due credit for the associated GHG reductions?
- The consumer products we devour require raw materials, processing, transport, and disposal, all of which produce emissions. Again, how do we account for the fact that most of all that happens outside the city? And how do we divide the responsibility for emissions between those who profit from the manufacture and sale of a product, and the end consumer of that product?
- The construction of infrastructure and buildings produces GHG emissions—a.k.a. “embodied carbon”—much of which is associated with materials that are typically brought in from far afield. Also, the existing built environment represents an embodied carbon “bank” that we effectively draw against when we demolish existing structures. The full embodied carbon impact of development needs to be a part of the inventory.
- Carbon offsets are a worthwhile strategy, but I believe they should not be included in GHG inventories, because they are analogous to handing the problem to someone else, and they also can mask the data that matter most—actual emissions.
- And lastly, how do make sure that focusing on GHGs doesn’t cause us to neglect other related impacts, such as how our Pacific Northwest hydropower dams have decimated what were not long ago the largest salmon runs on the planet.
The above points highlight that the establishment of a defensible inventory methodology is as challenge commensurate with the infinitely messiness of human systems. But it’s about time we got busy understanding our mess.
>>>
GHG data table after the jump…