Seattle’s Greenhouse Gas Inventory: Buildings
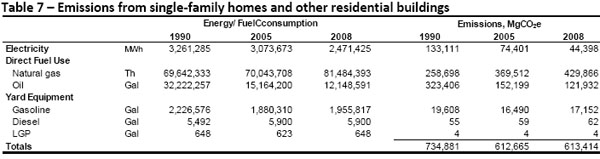
As noted in a previous post, the most striking success revealed in Seattle’s latest greenhouse gas (GHG) inventory is in the residential building sector: between 1990 and 2008, per capita GHG emissions dropped by 28 percent. To make sense of that, it helps to take a look at the residential energy data provided in the City’s full report, plotted below (taken from Table 7 at the bottom of the post):
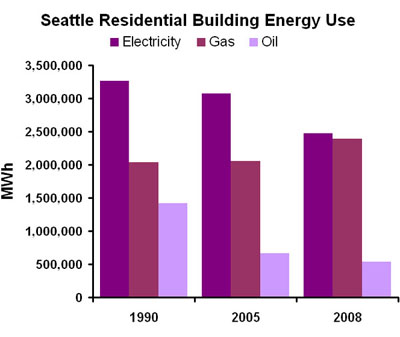
In Seattle’s residential building sector, between 1990 and 2008 total energy use fell by 20 percent, which, given the 16 percent growth in population during that time, is equivalent to a per capita reduction of 31 percent. That’s a lot. What happened?
The only reason the City’s report cites is conversion from oil to gas furnaces. One can speculate that tighter energy codes and efficiency upgrades (e.g. CFLs, insulation, etc.) also contributed. But here’s the thing: we seem to have made big improvements in our residential energy efficiency without really even trying that hard. It would be great to see some deeper analysis from the City on this, to help us better understand our progress.
The 20 percent drop in electricity use between 2005 and 2008 is curious—such a large decrease over a relatively short time period seems improbable. Either it’s bad data, or there’s something significant going on that we need to identify. The City report attributes the increase in gas use between 2005 and 2008 to an unusually cold winter—but many Seattle buildings are space heated with electricity, and thus one would also expect electrical demand to rise in cold weather.
So then, what could have had a big enough impact to cause that 20 percent net decrease in residential electricity use over three years? The recession? Lots and lots of CFLs? OSE or SCL, can you help us out here?
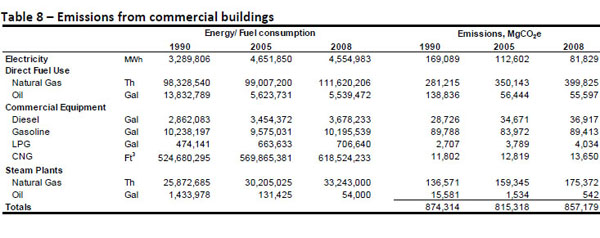
As is shown in Table 8 at the bottom of the post, unlike residential, commercial building energy use increased significantly between 1990 and 2008. Which raises an obvious question: why is residential doing so much better than commercial at improving efficiency? It matters, because the commercial sector consumes nearly twice the electricity that the residential sector does. Note also that there is a small drop in electricity use between 2005 and 2008, analogous to what was seen in residential. Related? The recession would seem to be a more plausible explanation in this case.
>>>
Now, to get a little deeper into the geeky weeds…
As can be seen in the bar chart, the dominant source of energy for residential buildings is electricity, but thanks to Seattle City Light and hydro dams, GHG emissions from electricity are relatively low compared to emissions from gas and oil (see GHG table here). If, however, Seattle’s electricity was like the average in the U.S, in 2008 the associated GHG emissions would be multiplied by about 38 times.
Again, since the electrical grid is regional, it seems it would be more realistic to apply a regional emissions factor to GHG inventory calcs. For the region encompassing WA, OR, and ID, the average emissions factor is about eight times larger than the emissions factor used in the 2008 Seattle inventory. And yes, that means the estimated GHG emissions from electricity would be eight times higher than the data points reported in the Seattle GHG inventory.
If the City of Seattle plans to develop policies based on GHG inventories, then care must be taken not to neglect the importance electricity simply because a localized interpretation says our particular electrons are carbon-free. And overall, since Seattle’s tentacles extend far beyond its borders, an honest accounting of GHG emissions must not be artificially bound by city lines.
UPDATE:Â See Sightline’s related post on GHGs and regional electricity.
>>>