What Density Looks Like
Much of the heat in the debate over urban density arises from a lack of understanding of what the metrics correspond to in the real world. Below is a series of slides presented at a public hearing on HB1490 by a colleague of mine from GGLO, that illustrates a wide range of densities, i.e, Density 101 for Legislators.
The first two slides address the difference between gross density and net density — this has been a source of confusion for HB1490 opponents, as discussed here.


>>>
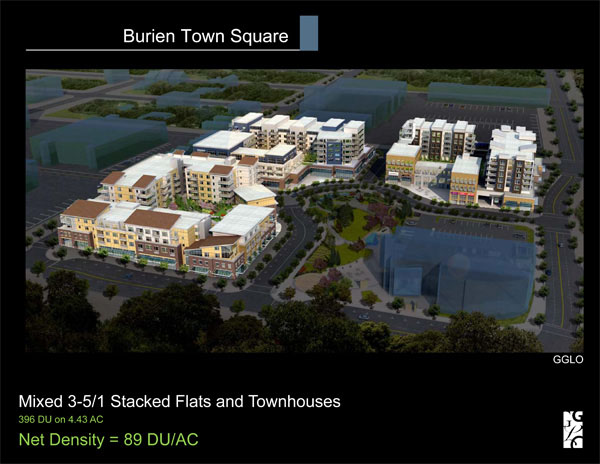
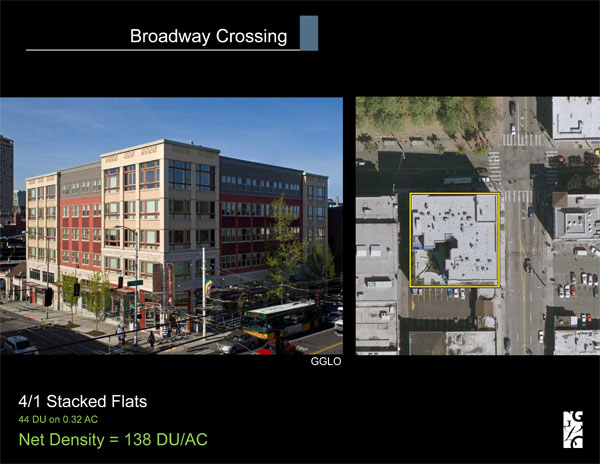
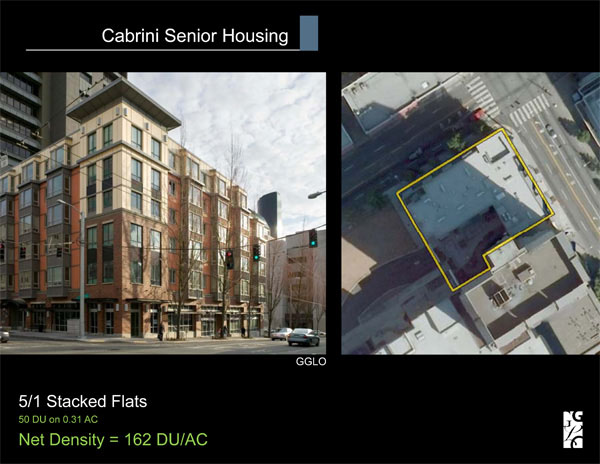
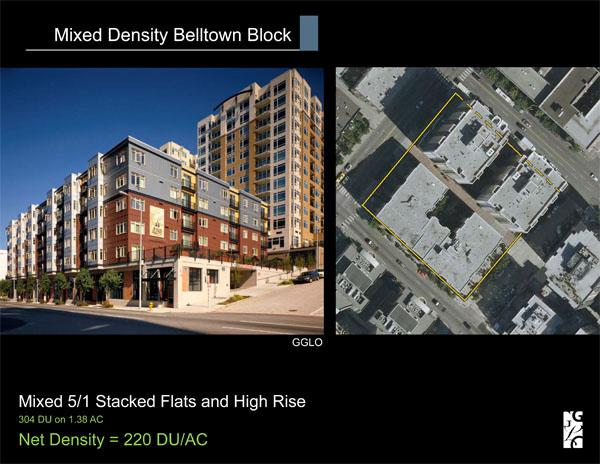
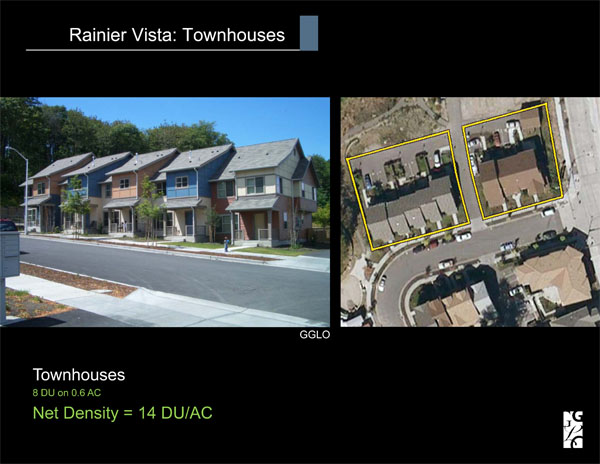
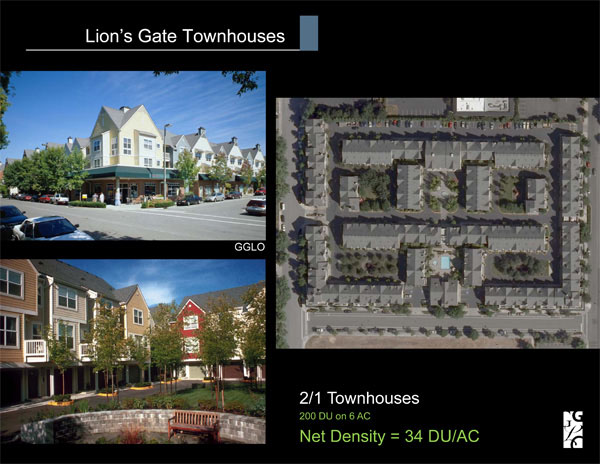
The following eight slides illustrate net densities ranging from 14 to 220 dwelling units per acre (DU/AC). Keep in mind that the proposed 50 DU/AC threshold in HB1490 is defined in terms of the net density allowed by zoning.


(Some or you smarty-pantses may recall that in this previous post I claimed that the net density in the Rainier Vista building shown above was about 100 DU/AC. My guess was high because I wasn’t considering the 3-story north end of the building, and also because I didn’t realize there is so much surface parking on the parcel. Go here to see an example of a 3-over-1 building with a net density of 99 DU/AC.)